barplot for fet enrichment test
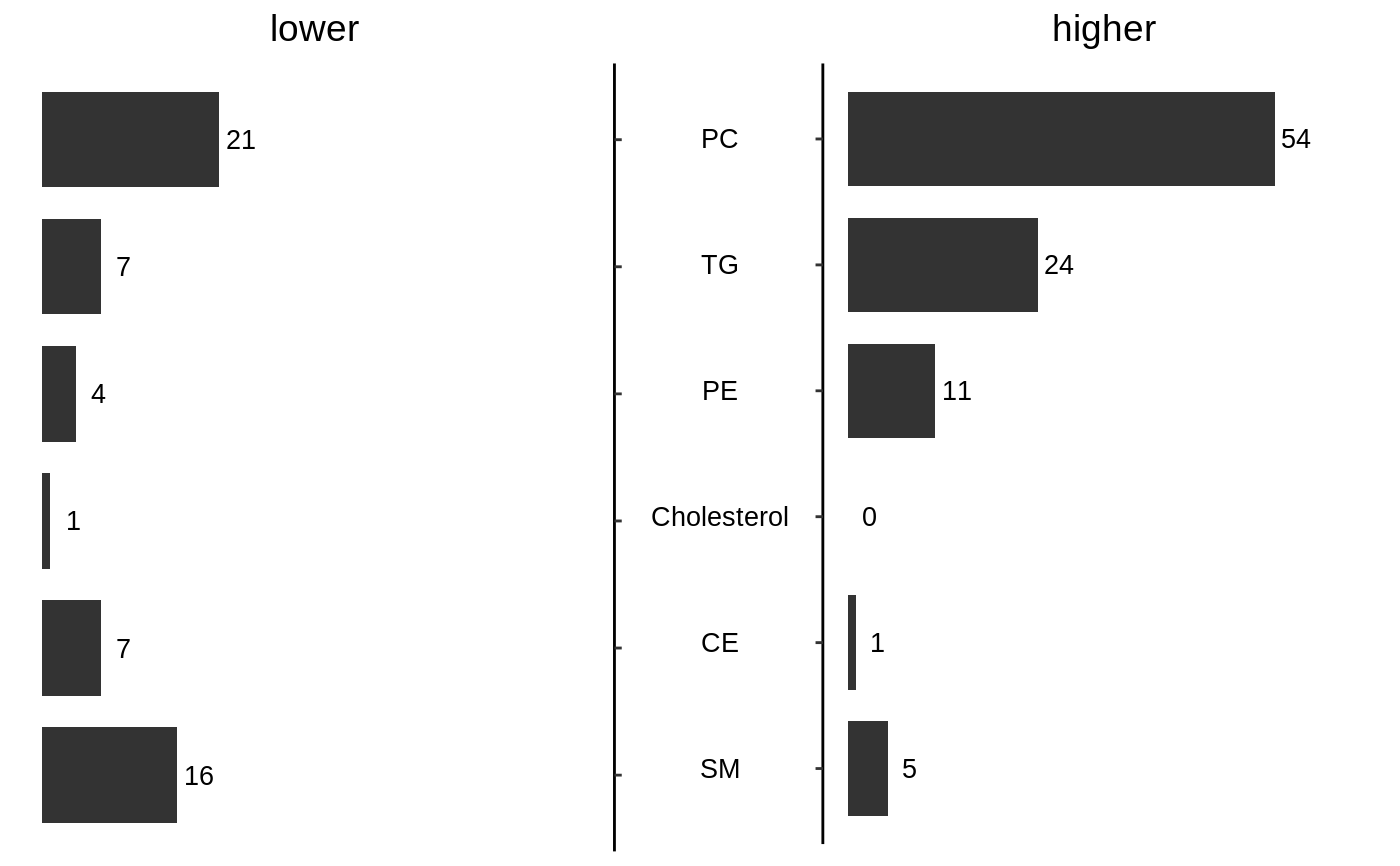
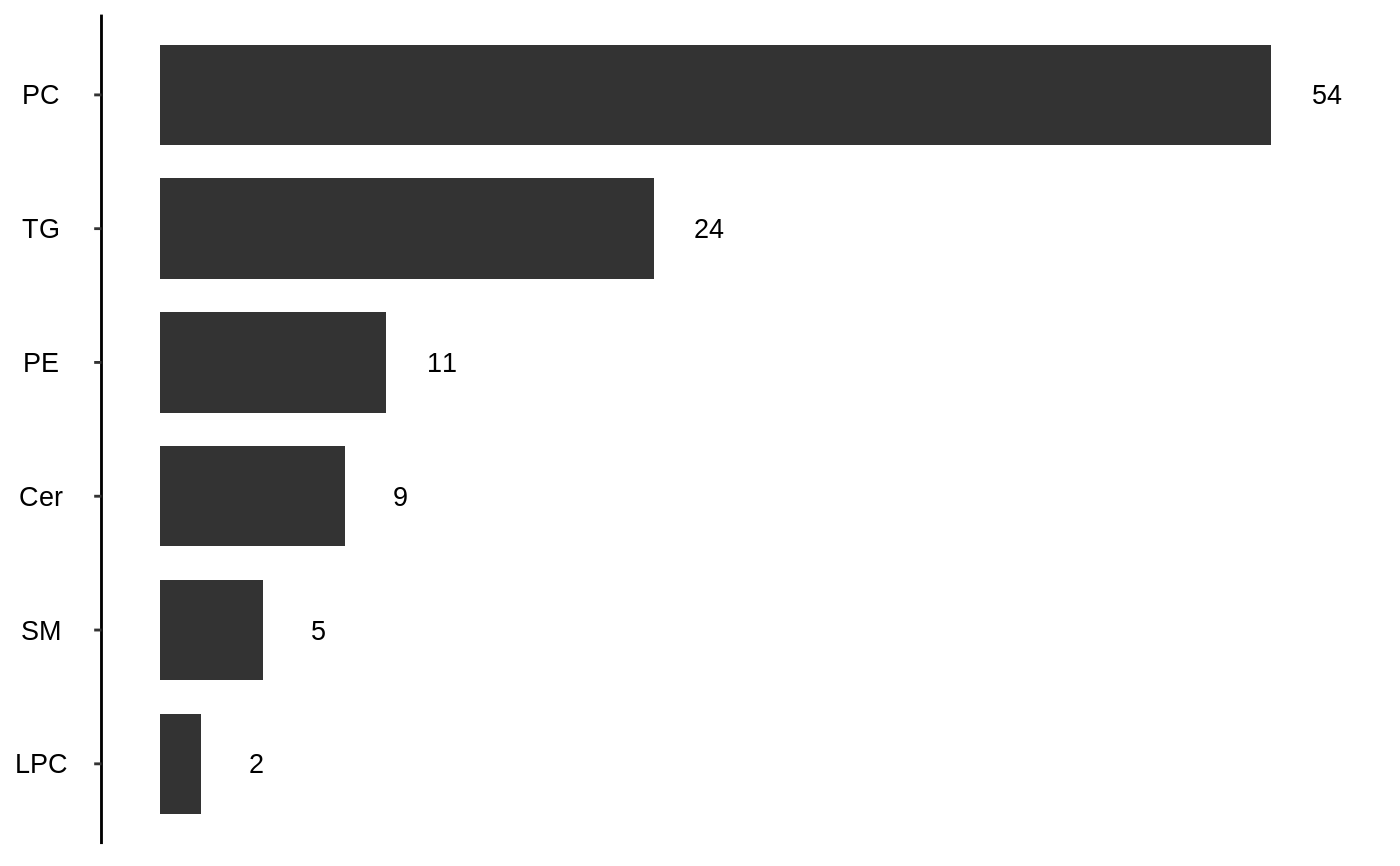
barplot.RdThis function makes bar plot for top most positively and negatively enriched levels.
barplot(x, ...)

# S3 method for EnrichmentFET
barplot(
  x,
  num = 6,
  greater = 3,
  less = 3,
  text.size = 10,
  fill = "gray20",
  panel.ratio = 1.2,
  title,
  ...
)
Arguments
| x | EnrichmentFET. Returned by |
|---|---|
| ... | other params not supported |
| num | integer. Number of categories to display. Use it when alternative equals to greater, less, or two.sided. |
| greater | integer. Number of categories which are greater. Use it when alternative equals to both. |
| less | integer. Number of categories which are less. Use it when alternative equals to both. |
| text.size | integer |
| fill | character. Bar fill color |
| panel.ratio | numeric. The ratio of left and right panels. |
| title | character. The title of the plot. |
Value
a ggplot object
See also
enrichment_test
Examples
lpd = transform_by_sample(lipidome, function(x) log(x/sum(x))) design = model.matrix(~Treatment * Timepoint + Subject, data = lpd$pdata) fit = model_fit(lpd, design, "TreatmentMed:TimepointPre", "limma")#>#> Warning: Use of `df$x` is discouraged. Use `x` instead.